
Publisher ad revenue per 1,000 visits can range from a few dollars to $20, $30 or even $50+ depending on audience geography, content vertical, engagement, ad formats and monetization setup. There is no single “correct” revenue benchmark that applies to every publisher.
The better question is: How much should your specific audience be worth per 1,000 visits?
That requires looking beyond traffic volume and understanding how effectively each visit is monetized.
Key Takeaways
- Publisher ad revenue varies widely by traffic quality and geography.
- Session RPM shows revenue earned per 1,000 visits.
- Higher engagement can increase monetization opportunities.
- Viewability and demand competition strongly influence RPM.
- Better yield optimization can grow revenue without more traffic.
How Much Can 1,000 Website Visits Generate in Ad Revenue?
Quick answer
For publishers, revenue per 1,000 visits should be treated as a site-specific benchmark rather than a universal industry rate.
A publisher with low-value traffic and limited demand could earn only a few dollars per 1,000 visits. A publisher with high-value audiences, strong engagement and competitive demand can earn tens of dollars from the same traffic volume.
Some publisher monetization benchmarks show just how wide the range can become. For example, session RPM for lifestyle publishers can range from roughly $5 to $75, depending on subvertical, geography and monetization sophistication.
So instead of asking whether $5, $15 or $30 is “good”, publishers should compare revenue against their own traffic mix and monetization potential.
What Does Ad Revenue Per 1,000 Visits Actually Mean?
Publishers often confuse CPM, Page RPM and Session RPM.
They measure different things.
CPM represents the value of 1,000 ad impressions.
Page RPM measures revenue generated from 1,000 pageviews. Google calculates it as:
Page RPM = Estimated Earnings ÷ Pageviews × 1,000
Google gives the example that $0.15 earned from 25 pageviews equals a $6 Page RPM.
Session RPM, or revenue per 1,000 visits, measures what an entire user visit is worth:
Session RPM = Total Ad Revenue ÷ Sessions × 1,000
EPMV, or earnings per thousand visitors, follows essentially the same visitor-level idea: total advertising revenue divided by visits and multiplied by 1,000.
That makes Session RPM particularly useful when answering the question: How much money does my traffic actually generate?
Interestingly, Google retired session-related metrics from the AdSense reporting interface in September 2025. Publishers can still calculate the metric themselves by combining revenue data with sessions from their analytics platform.
How Can Publishers Estimate Revenue Per 1,000 Visits?
One practical approach is to combine Page RPM with pages per visit.
Revenue per 1,000 visits ≈ Page RPM × Average Pages per Visit
Consider these illustrative examples:
| Scenario | Page RPM | Pages per Visit | Revenue per 1,000 Visits |
| Low monetization | $2 | 1.2 | $2.40 |
| Developing monetization | $5 | 1.4 | $7.00 |
| Strong monetization | $10 | 1.6 | $16.00 |
| High-value inventory | $15 | 1.8 | $27.00 |
| Premium scenario | $25 | 2.0 | $50.00 |
These are planning scenarios, not universal publisher ad revenue benchmarks.
They demonstrate why two websites receiving exactly 100,000 visits can generate dramatically different advertising revenue.
Raptive also notes that revenue per 1,000 sessions tends to be around 20–25% higher than revenue per 1,000 pageviews across its publisher environment because some sessions generate multiple pageviews and therefore additional ad auctions.
Why Does Publisher RPM Vary So Much?
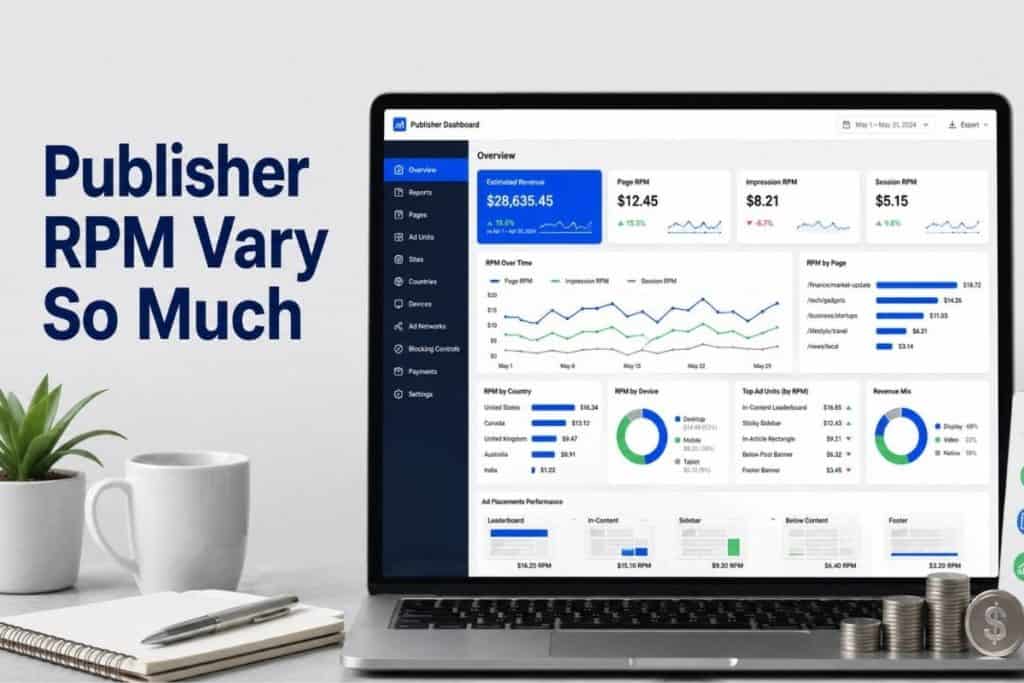
Audience Geography Changes Advertiser Demand
A visit from a market with strong advertiser competition can be worth significantly more than a visit from a market where programmatic demand is limited.
That means publishers should never analyse website ad revenue per 1,000 visitors without first segmenting performance by country.
A sudden RPM decline might simply reflect a shift in geographic traffic mix rather than a problem with the ad stack.
Content Vertical Changes the Value of the Audience
Advertisers do not value every audience equally.
Finance, technology, careers, automotive and high-intent commercial content can attract very different bids compared with broad entertainment or general-interest content.
Demand also changes over time.
For example, resources reported that Careers advertising spend increased 125% year over year in Q1 2026, while News experienced comparatively minimal overall growth during the same quarter.
This is why comparing the publisher RPM of a career portal with a general news site creates a misleading benchmark.
Pages Per Visit Multiply Monetization Opportunities
Suppose Publisher A and Publisher B both receive 100,000 sessions.
One Publisher A averages 1.1 pages per session.
While the other Publisher B averages 2 pages.
Publisher B potentially creates almost twice as many page-level monetization opportunities without acquiring another visitor.
This is why internal linking, recommendations, navigation and content depth can affect programmatic ad revenue just as much as ad configuration.
Viewability Influences Inventory Value
An ad impression has limited value if users never have an opportunity to see it.
The established IAB/MRC standard considers a display impression viewable when at least 50% of its pixels are visible for at least one continuous second. For video, the standard is two seconds.
Publishers should therefore evaluate:
- Viewability by placement
- Viewability by device
- Scroll behaviour
- Below-the-fold performance
- Layout shifts and loading delays
Simply adding more ad units does not automatically increase publisher RPM.
Demand Competition Determines What Inventory Sells For
A publisher relying on limited demand can have quality traffic but still generate weak revenue.
A stronger monetization environment gives multiple premium demand sources the opportunity to compete for inventory while intelligently balancing auction pressure, pricing, fill and user experience.
This is where ad yield optimization becomes more valuable than simply increasing ad density.
How Can You Tell If Your Publisher RPM Is Too Low?
Instead of comparing one headline RPM number with another website, investigate the underlying metrics.
| What You See | What It May Indicate |
| Low CPM + high fill | Weak advertiser demand or pricing |
| High CPM + low fill | Floors may be restricting demand |
| Good CPM + low Session RPM | Low session depth or few monetized impressions |
| Low viewability | Placement or page-layout issue |
| RPM decline in one country | Geographic demand change |
| RPM decline across the site | Demand, technical or yield-management issue |
The objective is to identify where value is being lost between the visitor arriving and the impression being monetized.
That makes the diagnosis far more actionable than simply saying “RPM is down.”
How Can Publishers Increase Ad Revenue Per 1,000 Visits?
Improve Revenue From Existing Inventory First
Before chasing more traffic, publishers should examine whether existing traffic is being monetized efficiently.
Review:
- Underperforming ad placements
- Viewability
- Fill rate
- Bid competition
- Pricing floors
- Device-level performance
- Geographic RPM
- Ad formats
- Content-category RPM
Even small improvements across several of these variables can compound into meaningful revenue gains.
Increase Session Depth Without Adding Ad Clutter
Encourage users to consume more relevant content through better internal links, related stories and navigation.
More quality pageviews per session can increase Session RPM while avoiding excessive advertising on individual pages.
Strengthen Programmatic Demand Competition
Publishers should create a monetization setup where quality demand sources compete efficiently for impressions rather than allowing inventory to depend on one limited buying channel.
A well-managed environment combines enterprise-grade ad serving, premium demand access, sophisticated programmatic auctions, pricing intelligence and transparent reporting.
Segment Revenue Instead of Watching One Average
A sitewide RPM hides opportunities.
Break performance down by:
- Country
- Device
- Traffic source
- Content section
- Ad unit
- Browser
- New vs returning visitors
Your highest-value audience segment may already be showing you where future revenue growth should come from.
How Do You Forecast Monthly Publisher Ad Revenue?
Once you know your Session RPM, forecasting becomes straightforward.
Estimated Monthly Revenue = Monthly Sessions ÷ 1,000 × Session RPM
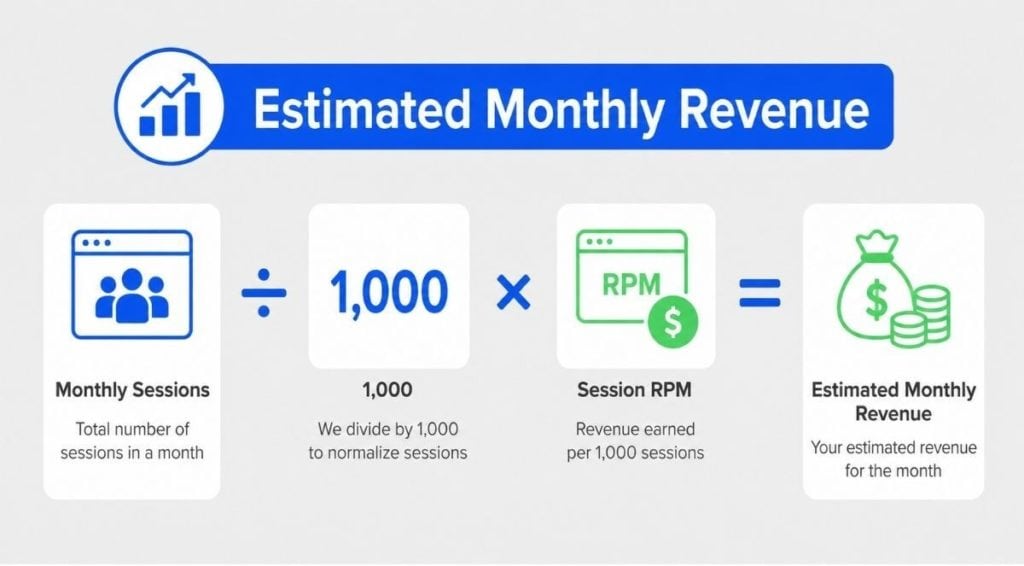
For example:
500,000 monthly visits × $12 Session RPM ÷ 1,000 = $6,000 monthly ad revenue
At a $20 Session RPM:
500,000 visits = $10,000
This calculation also demonstrates why improving monetization efficiency can sometimes be more profitable than buying or creating additional traffic.
In The End
Stop Asking What 1,000 Visits “Should” Earn
Traffic alone does not determine publisher revenue.
The real opportunity lies in understanding how audience quality, engagement, viewability, demand competition and yield strategy work together to determine the value of every visit.
If your traffic is growing but publisher ad revenue is not keeping pace, the issue may not be traffic at all. It may be hidden inside your monetization setup.
Turn More of Your Existing Traffic Into Revenue With Auxo Ads
Auxo Ads helps publishers build stronger monetization strategies around advanced ad management, competitive premium demand, programmatic optimization, inventory intelligence and data-driven revenue engineering.
Instead of simply increasing ad volume, focus on making every eligible impression and every visitor more valuable.
Explore Auxo Ads and improve your publisher monetization strategy
Visit the Auxo Ads Blog for publisher and AdTech insights and subscribe to the newsletter for practical monetization strategies, industry updates and publisher revenue insights delivered regularly.
Frequently Asked Questions
- What is a good RPM for a publisher?
There is no universal good publisher RPM. Geography, vertical, page depth, demand competition, formats and seasonality all influence revenue. Compare RPM against your own audience segments and historical performance.
- Is RPM the same as CPM?
No. CPM represents advertiser cost per 1,000 ad impressions. RPM represents publisher revenue per 1,000 pageviews, sessions or impressions depending on which denominator is being used.
- Is Session RPM better than Page RPM?
Neither replaces the other. Page RPM measures individual page monetization, while Session RPM measures total revenue generated during an entire visitor journey. For forecasting visitor value, Session RPM is particularly useful.
- Why can ad revenue fall even when website traffic grows?
Traffic may shift toward lower-value countries, mobile devices or less commercial content. Lower viewability, reduced demand, poor fill, seasonality or weaker session depth can also reduce revenue.
- Should publishers add more ads to increase RPM?
Not automatically. Excessive ad density can damage page speed, engagement and viewability. Publishers should optimize revenue per visit rather than maximizing the number of ad units.






The bonus options here are insane. I managed to hit a decent streak last night thanks to the promotions. You should give inyono789 a shot!
Such a fun vibe on this platform! I love how the slots feel and the bonuses keep me coming back. I’m really enjoying my time at phjililove.
Top notch service and very responsive support team. It’s rare to find a site this reliable these days. Give idug234 a try!
Simple, clean, and effective. I love how they keep the gameplay focused without too much clutter on the screen. Glad I found jdlovelink.
Super legit site! I love how the Jili games feel here. The payouts are quick and the customer support is very helpful. Go to ph77jili
Finally found a platform that actually pays out quickly. The customer support is top notch and very helpful with my deposit. Definitely recommend bdft999.
I was skeptical at first but this place is legit. Smooth transactions and a great variety of options to choose from. pk1777xs
A hidden gem for anyone who loves online gaming. Everything is well organized and runs perfectly. Visit br3633bt now.
I am really enjoying the bonuses they offer for new users. It is a great way to start. The app is very stable too. Check out 168jlloginapp