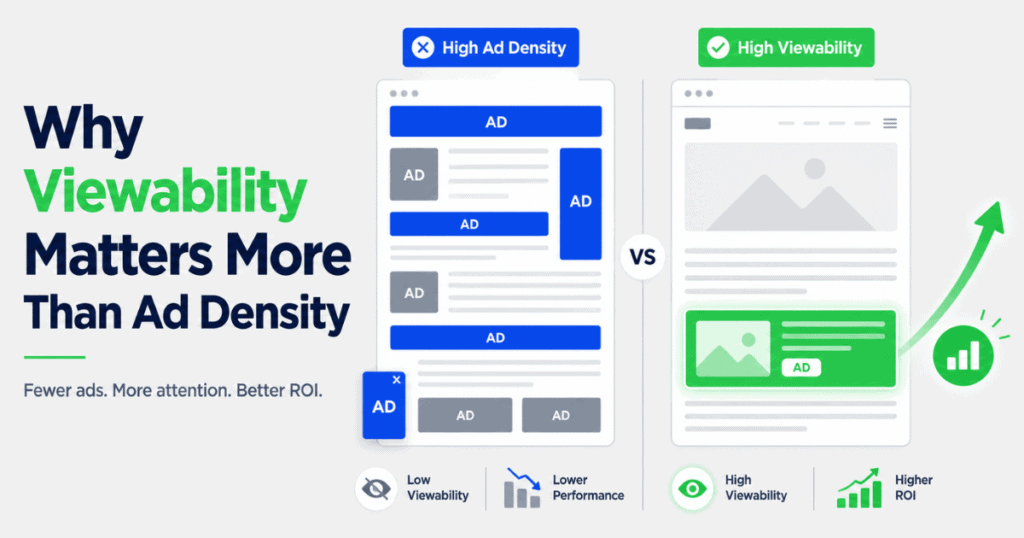
A page filled with unseen ads has no value, while a well-placed ad draws attention and delivers measurable ROI. This distinction highlights the importance of ad viewability as the standard that separates real advertising impact from inflated inventory numbers.
What Is Ad Viewability?
Ad viewability is a measurement standard that determines whether a digital ad was actually visible to a user. The Media Rating Council (MRC) introduced viewability standards in 2014:
- Display ads: At least 50% of the ad’s pixels must appear in an active browser tab for at least one continuous second.
- Video ads: At least 50% of pixels must be visible for at least two continuous seconds.²
- Large display ads: At least 30% of pixels visible for at least one second.
The thresholds address a critical issue: many served impressions are never actually seen by humans. Google’s 2014 study found that 56.1% of impressions across its display platforms were not viewable. Simultaneously, third-party research reported 53.4% non-viewable impressions for direct publisher buys and 36.7% viewable impressions on ad networks and exchanges.
Viewability only measures whether the ad had the opportunity to be seen, not whether it actually was. That withstanding, it still puts viewability far ahead of raw impression counts as a quality signal.
What Is Ad Density?
Ad density is the ratio of advertising content to editorial content on a page. A high-density page stuffs multiple ad units into every available slot, such as between paragraphs, in sidebars, in the header, in sticky positions, and in interstitials.
The Coalition for Better Ads defines a specific threshold. When mobile ads occupy more than 30% of the vertical height of the main content area on a page, it is considered a disruptive ad experience. The CBA identified this threshold through research involving more than 25,000 internet users in North America and Europe who were surveyed about their preferences across 49 mobile ad experiences.
Google Chrome bases its ad density enforcement on these standards. Sites flagged for exceeding the density threshold enter Google’s Ad Experience Report review process, with non-compliant sites at risk of having ads blocked entirely.
While ad density is easy to measure and manipulate, viewability is much harder to game. This difference is the basis for the shift toward viewability.
Why Publishers Chased Density and Why It Failed
For the longest time, publishers were paid on a Cost Per Mille (Mille = 1,000 impressions) basis. More ad units meant more impressions, which meant more revenue. The incentive structure rewarded quantity over quality.
Programmatic buying made it cheap to flood a page with ads. Advertisers paid for every impression served, regardless of the actual impact on users. Eventually, publishers found that adding a fifth or sixth ad unit to a page only accelerated harm to user experience, with slower load speeds and cluttered layouts, while yielding diminishing returns in revenue. This, in turn, hurt the brand or platform’s reputation.
By December 2016, ad-blocking software was running on over 615 million devices globally, up 30% that year alone, according to PageFair’s annual report. 62% of those installs were on mobile devices. PageFair’s research further found that adblock usage was driven by specific problems with ad delivery, rather than a blanket rejection of advertising itself.
In response, the market shifted spending toward viewable impressions. Buyers began using viewability filters in their DSPs and avoided inventory that underperformed viewability benchmarks. Consequently, publishers relying on high ad density saw their fill rates decline.
The Business Case for Ad Viewability Over Density
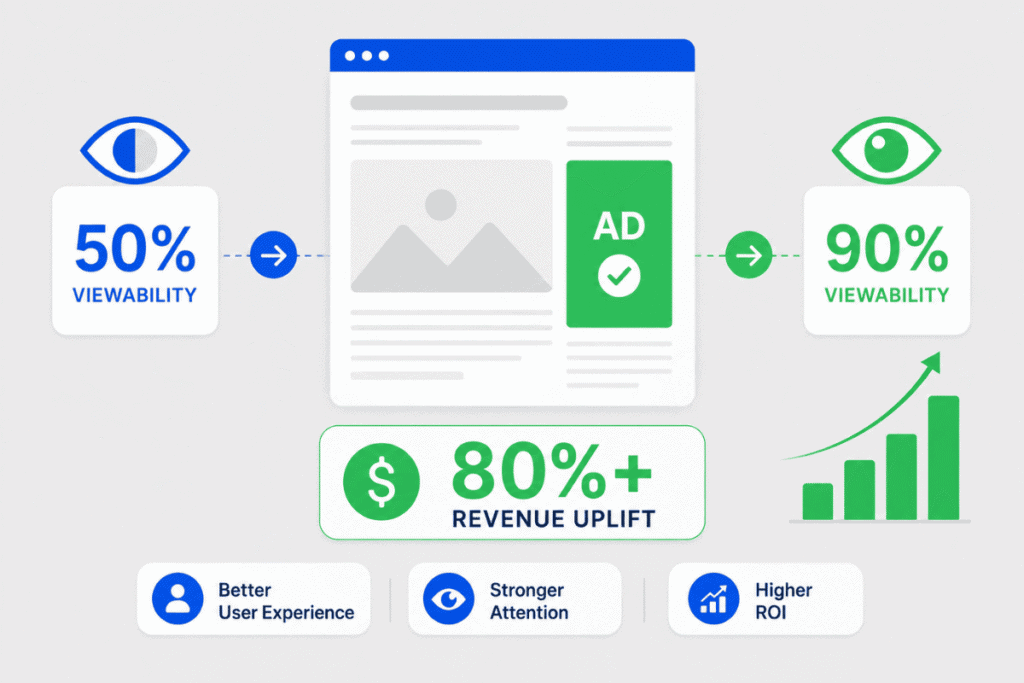
1. Higher Ad Viewability Directly Increases Publisher Revenue
According to Google Ad Manager, raising ad viewability from 50% to 90% can yield a revenue uplift of more than 80% for publishers.
2. Ad Viewability Correlates with Brand Recall and Awareness
Google’s DoubleClick also found a consistent relationship between time-in-view and brand awareness and consideration, i.e., the longer a user views an ad, the greater the lift in these two brand metrics. A separate study by TubeMogul demonstrated that viewable video ads drove statistically significant lift in product awareness, message recall, and purchase intent compared to the control groups not exposed to any ads.
3. High-Density Pages Suppress Individual Ad Performance
When multiple ad units compete for attention on the same page, each unit cannibalizes the others. AdExchanger notes that even individually compliant ad formats can create a poor user experience when stacked. Placing more than two compliant ads often exceeds the Coalition for Better Ads’ 30% density cap and enters Chrome’s enforcement zone. Users on cluttered pages develop banner blindness more quickly, leading them to avert their gaze from areas associated with ads.
4. Ad Viewability Filters Are Now Standard Buying Behavior
Most major advertisers and agency trading desks apply minimum viewability thresholds when activating programmatic campaigns. The IAB recommends a 70% viewability threshold, and many direct buyers require the same or higher as a contractual baseline. Publishers who cannot demonstrate strong viewability rates are excluded from these buying pools.
5. Core Web Vitals Connect Viewability to Organic Search Performance
Google’s ranking algorithm includes Core Web Vitals, which penalize pages for layout instability (CLS), poor responsiveness (INP), and slow loading (LCP). Google’s CLS metric, which measures unexpected layout shifts as a page loads, is directly worsened by dynamically injected ad units. High ad density is a leading cause of elevated CLS scores. Publishers who reduce density and optimize for viewability often see improvements in both LCP and CLS scores, which, in turn, can boost organic search visibility. Viewability optimization and SEO are not competing priorities; they reinforce each other.
How to Measure Ad Viewability?
The primary tools used for third-party viewability verification are:
- Integral Ad Science (IAS): Widely used by both publishers and buyers; provides viewability, brand safety, and fraud measurement. IAS data shows that US desktop display viewability improved from 69.8% to 72.3% between reporting periods, with mobile app display reaching 89.3%.
- DoubleVerify (DV): Similar capabilities; particularly strong in CTV and video measurement. In Q3 2024, DV reported overall authentic display viewability at 71%, with mobile apps leading at 85%.
- Google Active View: Built into Google Campaign Manager and available through Google Ad Manager for publishers; uses MRC-accredited methodology.
- Adelaide, Lumen Research, Playground xyz: Attention measurement vendors that go beyond basic viewability to estimate whether a user actually looked at an ad, using eye-tracking panels and predictive models.
The IAB and MRC published updated Attention Measurement Guidelines in November 2025, building directly on established MRC viewability standards and requiring ads to first meet core viewability thresholds as a foundation before evaluating deeper attention signals.
Key viewability benchmarks (source: IAS Media Quality Report / DoubleVerify Global Insights):
| Format | Industry Average Viewability | Strong Performance |
| Display (desktop) | ~72% | 80%+ |
| Display (mobile web) | ~69% | 75%+ |
| Mobile app display | ~85–89% | 90%+ |
| Video (in-stream) | ~74–80% | 85%+ |
| CTV | ~93% | — |
Native advertising steadily outperforms standard display in terms of viewability because it loads inline with content rather than in peripheral positions. Trend data shows native viewability rising from 60.1% in 2015 to a projected 80.5% by 2025, consistently ahead of display and video formats.
The Attention Economy Makes Viewability the Floor, Not the Ceiling
Viewability is the entry-level standard. The frontier of advertising effectiveness measurement has moved toward attention metrics: active dwell time, eye-tracking proxies derived from scroll velocity and cursor movement, and engagement rate signals.
Lumen Research, Adelaide, and Playground xyz have all worked with major brands, including AB InBev, Coca-Cola, Mars, and HP, to embed digital campaigns with attention metrics, combining eye-tracking data with web page layout information to estimate whether users actually looked at an ad. Adelaide’s 2024 Outcomes Guide, spanning 45 case studies across 18 industries, demonstrated an average upper-funnel lift of 40% and a lower-funnel lift of 53% from attention-optimized campaigns, along with 37% in cost savings.
Adelaide and Lumen are now integrated with programmatic partners, including Amazon and The Trade Desk, allowing advertisers to use attention metrics to influence bids.
The IAB Australia reviewed nine attention measurement vendors. It determined that while attention metrics show strong correlation with brand outcomes, they work best as a complement to existing metrics — with viewability remaining the essential baseline.
This trajectory confirms the central argument: density is a metric that served the supply side of advertising at the expense of the demand side. Viewability began rebalancing that equation. Attention measurement continues on the same project. Publishers who treat their editorial environment as a quality signal, not simply a container for inventory, will be better positioned for every stage of the measurement evolution.
What This Means for Advertisers Buying Digital Media
If you are buying a programmatic display, apply viewability filters as a minimum hygiene standard. Campaigns running without viewability floors are paying for a significant proportion of impressions that could not have influenced any consumer.
Prioritize publishers who can provide viewability data at the placement level, not just site-wide averages. Site-wide averages mask enormous variation. Publishers who cannot demonstrate strong viewability data and offer viewability-guaranteed placements are locked out of the most valuable segment of the direct-sold market.
Consider private marketplace deals with publishers who offer viewability guarantees with make-good provisions. At 70–80% viewability, CPMs are four times higher than at low-viewability rates, but the effective cost per viewable impression often compares favorably once waste is removed.