
Publishers searching for a good RPM for publishers in 2027 will quickly run into a problem: there is no universal number.
A $5 RPM can be healthy for one website and disappointing for another. A $20 RPM can look impressive but still hide poor fill, weak engagement, or missed revenue opportunities.
So, instead of asking, “What RPM should I have?” publishers need to ask a better question:
Is my inventory earning as much as it reasonably should for its audience, format, geography, and demand environment?
That is what a useful publisher RPM benchmark should answer in 2027.
Key Takeaways
- There is no universal “good” RPM benchmark.
- Compare RPM across similar inventory and audience segments.
- Higher CPM does not always mean higher publisher revenue.
- Demand competition, viewability, pricing, and latency influence RPM.
- Optimize RPM alongside fill rate, engagement, and total revenue.
What Does RPM Mean for Publishers?
RPM, or revenue per thousand impressions, measures how much revenue a publisher generates for every 1,000 page views or ad impressions.
Google defines page RPM as:
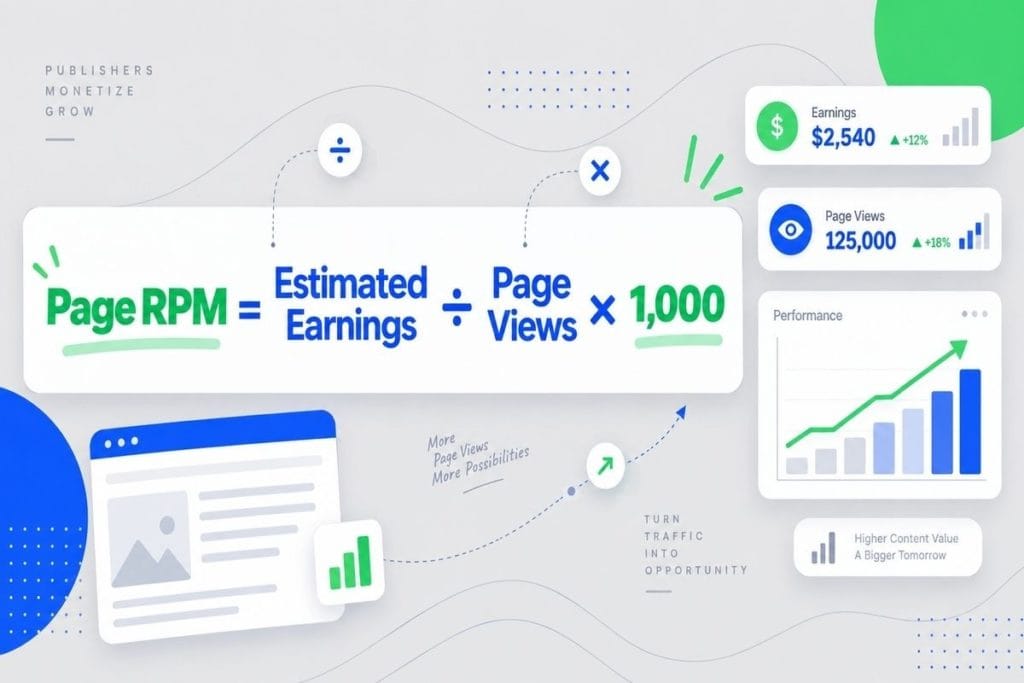
Ad RPM uses the same logic but measures earnings against ad impressions rather than page views.
This distinction matters.
A publisher may have a strong ad RPM but weak page revenue because too few impressions are being created or monetized. Another publisher may increase ad density and raise short-term page RPM while damaging user experience.
That is why RPM should be treated as a revenue-efficiency metric, not simply a number to maximize.
So, What Is a Good RPM for Publishers in 2027?
A good RPM in 2027 is an RPM that performs above the realistic benchmark for your specific inventory while maintaining healthy fill, engagement, viewability, and user experience.
There is no reliable industry-wide number such as “$10 is good” or “$20 is excellent.”
Publisher revenue per 1,000 visits can range from a few dollars to $20, $30, or even $50+ depending on geography, niche, user intent, ad formats, engagement, seasonality, and monetization setup.
The more useful comparison is against publishers or inventory with similar characteristics.
For example, premium U.S. finance traffic should not be benchmarked against broad global entertainment traffic. Desktop long-form content should not automatically be compared with mobile news traffic. Display inventory should not be benchmarked directly against video inventory.
Context determines whether an RPM is good.
Why Publisher RPM Benchmarks Will Become Harder to Compare
The advertising market continues to grow.
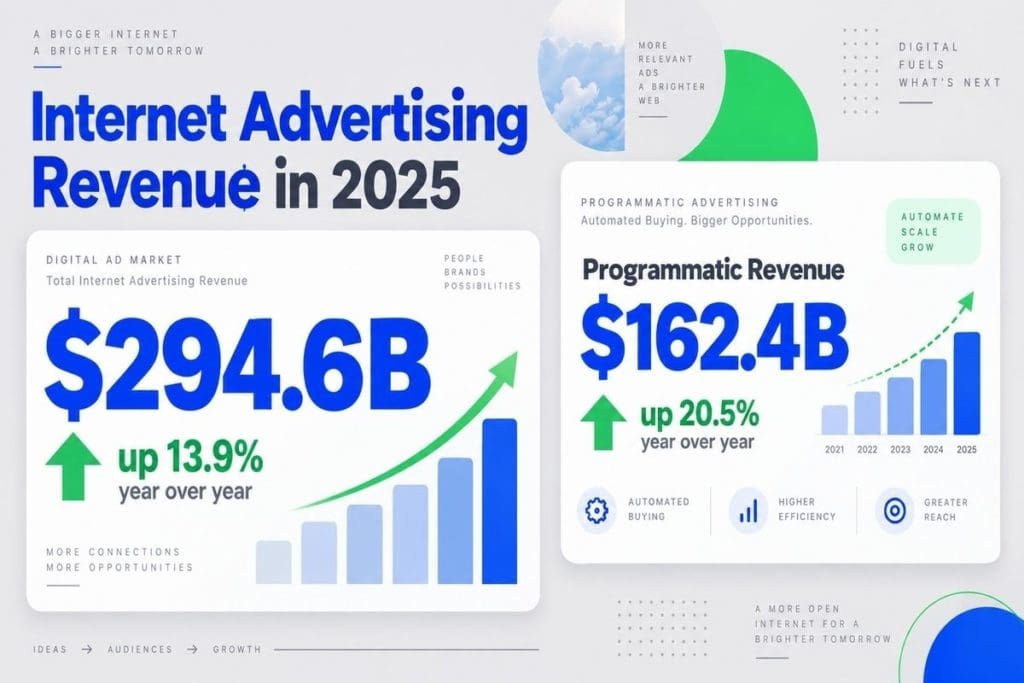
IAB reported that U.S. internet advertising revenue reached $294.6 billion in 2025, up 13.9% year over year. Programmatic revenue increased even faster, reaching $162.4 billion, representing 20.5% year-over-year growth.
At first glance, that sounds like great news for publishers.
But rising ad spend does not automatically translate into rising publisher RPM.
WARC has forecast the global advertising market to reach approximately $1.40 trillion in 2027, with growth of 7.9%. Yet it also expects a large share of incremental advertising investment to remain concentrated among major technology platforms.
That creates the central RPM problem for independent publishers:
Advertiser budgets can grow while publisher yield remains flat.
The difference comes down to how efficiently publishers compete for those budgets.
What Factors Determine Your Publisher RPM Benchmark?
Your publisher RPM benchmark should be segmented rather than calculated as one site-wide average.
Audience Geography
Advertiser demand differs dramatically by country and region.
Traffic from markets with high advertiser competition can attract stronger bids. Traffic from lower-demand markets may generate significantly lower RPM even when engagement is strong.
Always compare RPM by geography before assuming your monetization is underperforming.
Content and User Intent
Advertisers generally value audiences differently based on commercial intent.
A user researching investments, business software, insurance, or technology may create a different revenue opportunity from someone browsing general entertainment content.
This is why niche quality can matter more than raw traffic volume.
Device Mix
Mobile, desktop, tablet, app, and connected environments behave differently.
Ad sizes, viewability, user behavior, auction competition, and session depth all affect revenue.
A sudden shift toward mobile traffic, for example, can change average page RPM even when total traffic increases.
Ad Format
Display, native, video, and other formats should not share one RPM expectation.
Video deserves particular attention going into 2027.
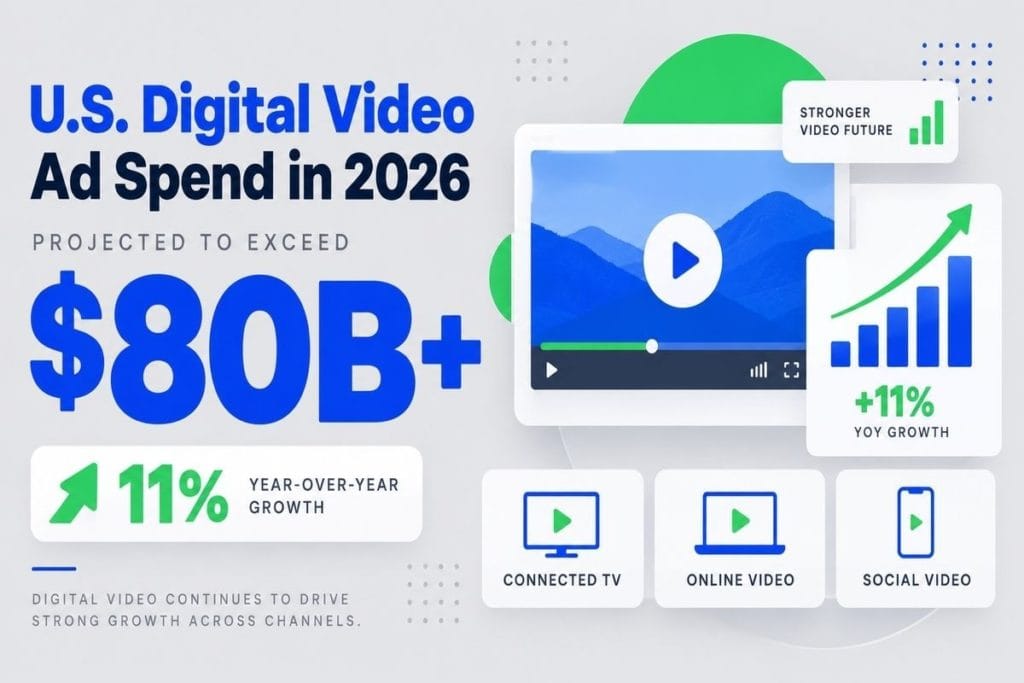
IAB projected U.S. digital video advertising spend to exceed $80 billion in 2026, growing 11% year over year.
Publishers with suitable content and inventory therefore have an opportunity to diversify beyond traditional display monetization.
Demand Competition
Having demand connected does not mean that demand is competing effectively.
Weak bidder participation, poorly configured auctions, limited demand diversity, inefficient supply paths, or pricing mistakes can suppress RPM.
The goal is not simply to add more buyers. It is to make qualified demand compete efficiently for each impression.
Why High CPM Does Not Always Mean High RPM
Understanding RPM vs CPM is essential.
CPM measures what advertisers pay for 1,000 impressions. RPM measures what the publisher actually earns relative to page views or impressions.
A publisher might increase floors and see CPM rise from $2.50 to $4.00.
That looks positive.
But if the fill rate collapses, total revenue may fall.
The opposite can also happen. A slightly lower average CPM can generate more publisher revenue when increased auction participation and fill create more monetized impressions.
This is why ad yield optimization should focus on total revenue efficiency rather than one isolated metric.
Publishers should evaluate CPM, fill rate, viewability, bid density, revenue per session, page RPM, and total revenue together.
Why Your RPM May Be Low Even When Traffic Is Growing
One of the most frustrating publisher problems is seeing pageviews rise while revenue barely moves.
That usually means the problem is not traffic volume.
It is monetization efficiency.
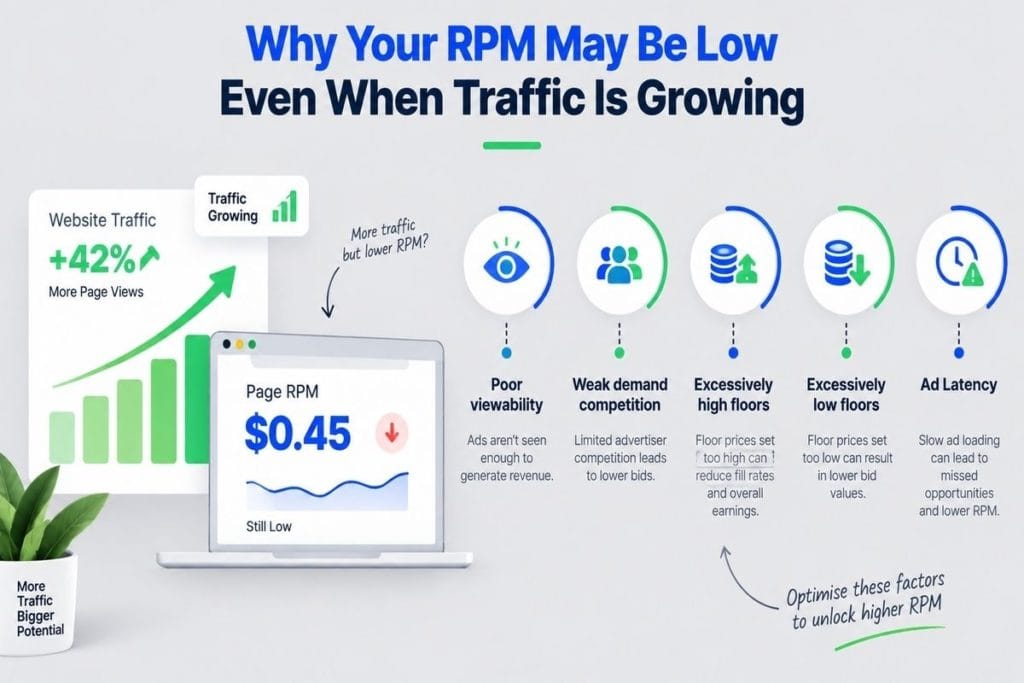
Poor viewability can reduce advertiser willingness to bid. Weak demand competition can leave impressions underpriced. Excessively high floors can reduce fill. Excessively low floors can prevent publishers from capturing the real value of premium inventory.
Latency can also reduce auction participation.
And adding more ads can backfire if the resulting experience reduces engagement, pages per session, or repeat visits.
A better publisher monetization strategy therefore asks where revenue is being lost between the ad request and the final impression.
How Should Publishers Increase RPM in 2027?
The first step to increase publisher RPM is segmentation.
Analyze revenue separately by geography, device, page type, format, traffic source, placement, and demand channel.
Then identify where valuable inventory is being undervalued.
The next step is stronger auction competition. Premium inventory needs access to qualified demand from multiple established buying environments rather than depending too heavily on one route.
Pricing also needs continuous testing.
Static floor strategies become less useful when advertiser demand changes by hour, user, device, geography, and season.
Publishers should also explore richer monetization opportunities where they fit naturally. Digital video is one example, especially as advertiser investment continues shifting toward video-based environments.
Finally, monetization technology should work as one connected system.
Ad serving, demand access, auction strategy, reporting, pricing, policy management, and yield optimization should reinforce each other rather than operate as separate tools.
What Will Define a Strong RPM Strategy in 2027?
The strongest publishers will stop treating RPM as a scoreboard.
They will treat it as a diagnostic signal.
A falling RPM should trigger questions.
- Did traffic geography change?
- Did fill fall?
- Did an important demand source stop bidding?
- Did viewability decline?
- Did floor changes reduce auction participation?
- Did page speed affect monetization?
- Is high-value inventory being packaged correctly?
That shift matters as AI becomes more deeply involved in programmatic pricing, bidding, forecasting, and optimization.
IAB notes that AI is already influencing how video inventory is evaluated, priced, packaged, bought, and optimized, while increasing the importance of transparency across the programmatic supply chain.
In other words, 2027 monetization will require more intelligence, not simply more ad slots.
Conclusion: Stop Chasing Someone Else’s RPM
So, what is a good RPM for publishers in 2027?
It is not one universal dollar figure.
A good RPM reflects the full value of your audience and inventory after accounting for geography, format, device, engagement, seasonality, demand competition, and user experience.
The goal is not to beat an arbitrary industry number.
The goal is to determine whether your existing inventory could be earning more.
That requires transparent reporting, premium demand access, competitive auctions, smarter pricing, stronger ad operations, and continuous yield optimization.
Auxo Ads helps publishers bring those pieces together to identify monetization gaps, strengthen demand competition, optimize inventory performance, and build a more sustainable revenue strategy.
Your traffic already has value. The question is whether your monetization setup is capturing enough of it.
Ready to turn RPM from a dashboard metric into a growth strategy?
Explore Auxo Ads and discover smarter publisher monetization
Don’t just watch AdTech change. Stay ahead of it. Explore practical publisher monetization insights on the Auxo Ads Blog and follow Auxo Ads on LinkedIn for the latest ideas on programmatic advertising, yield optimization, publisher revenue, and the future of digital monetization.
Frequently Asked Questions
1. What is considered a good RPM for publishers in 2027?
A good publisher RPM depends on geography, niche, device, format, audience quality, demand competition, seasonality, and user experience. Publishers should benchmark comparable inventory instead of chasing one universal figure blindly.
2. What is the difference between RPM and CPM?
RPM measures publisher earnings per thousand page views or ad impressions, while CPM measures advertiser cost per thousand impressions. RPM better reflects overall monetization efficiency and realized publisher revenue earned.
3. Why can publisher RPM fall even when traffic increases?
Traffic growth does not guarantee revenue growth. Poor viewability, weak demand competition, unsuitable floors, latency, changing traffic quality, or low-value geographies can reduce RPM despite increasing pageviews significantly over time.
4. How can publishers increase RPM in 2027?
Publishers can improve RPM by segmenting inventory, strengthening demand competition, testing floor prices, improving viewability, reducing latency, optimizing ad formats, and monitoring revenue alongside fill and engagement metrics consistently today.
5. Which metrics should publishers track alongside RPM?
Publishers should monitor page RPM, ad RPM, CPM, fill rate, viewability, bid density, revenue per session, traffic quality, and engagement together to identify monetization gaps and emerging revenue opportunities early.







I have been searching for a smooth and secure betting platform for a long time and finally found my comfort zone here. The interface feels so welcoming that I forgot I was dealing with a website. Everything runs smoothly and I love how responsive the team is. Check it out for yourself at iw1015login